
- Standard price
- $89.00 a month
- Free plan
- No free plan for the platform (only a free tier of its AI assistant)
- Free trial
- No trial
- Standard price
- $14.95 a month or $155.40 a year
- Free plan
- Yes. Basic plan, free forever, no card. 1 chart per tab, 2 indicators per chart, 1 watchlist of 30 symbols, 3 price alerts, 5K historical bars
- Free trial
- Free trial
Official US prices from each offer page. The deals are what our links open: click through and the discount or trial is applied there. We may earn a commission, at no extra cost to you.
TrendSpider and TradingView are both charting platforms, and both are popular with people who use technical analysis. They are built for different users, though. TradingView is a charting site that almost anyone can start on for free, with data for markets around the world. TrendSpider is a paid tool for active traders that does much of the chart work for you, such as drawing trendlines and spotting patterns.
This page compares TrendSpider vs TradingView in plain English: the free plan and trial, prices, the main tools, which markets they cover, and who each one suits. Facts come from the official TrendSpider and TradingView pages, read on 4 Nov 2026. It is general information, not advice.
Most beginners should start with TradingView's free Basic plan, and TrendSpider may suit you later if you trade often in US markets and want automated chart tools, though it has no free plan.
TrendSpider vs TradingView: the main difference
TradingView is where many people first learn to read a chart. You get interactive charts with 400+ built-in indicators, drawing tools, screeners for 150+ exchanges, price alerts and a large community that shares chart ideas. You can also write your own indicators in its Pine Script language.
TrendSpider focuses on automating chart analysis. Its pricing page lists automated trendlines and Fibonacci levels, chart pattern recognition, 300+ indicators, strategy scans, backtesting, multi-factor alerts and trading bots. Every plan includes all features; higher plans raise limits such as the number of alerts and how far back backtests go (TrendSpider pricing).
Put simply: TradingView gives you the tools to draw and study charts yourself. TrendSpider tries to do more of the drawing and testing for you.
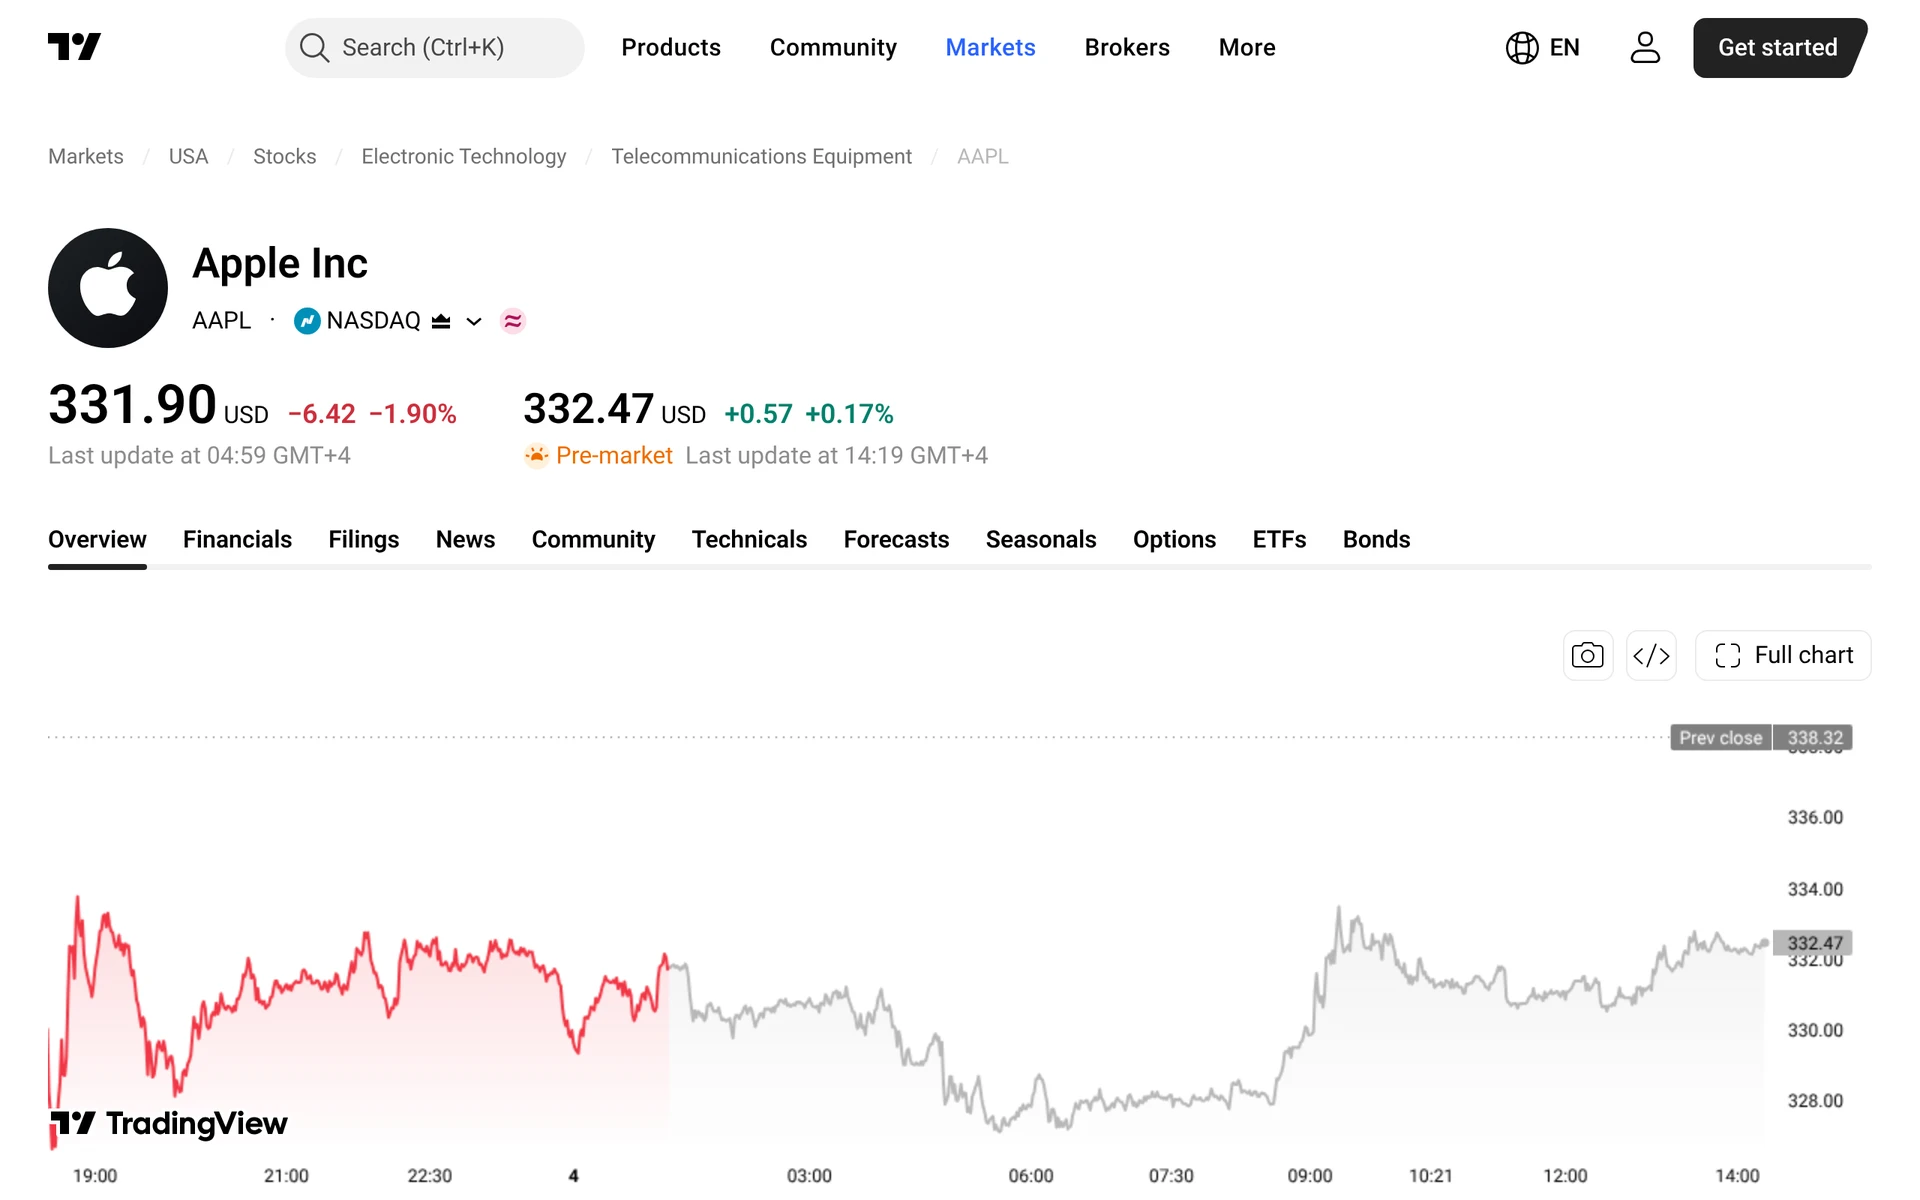
Side by side
| TrendSpider | TradingView | |
|---|---|---|
| Free plan | No (only its AI assistant has a free tier) | Yes, Basic, free with no card |
| Trial | 14-day paid trial from USD 19 | Free trial on Essential, Plus and Premium |
| Cheapest paid plan | Standard: USD 89 a month billed monthly, from USD 54 a month prepaid | Essential: USD 14.95 a month, or USD 12.95 a month billed yearly |
| Automated chart tools | Automated trendlines, Fibonacci levels and chart pattern recognition on every plan | Auto chart patterns and candlestick pattern recognition listed on paid plans; trendlines are drawn by hand |
| Backtesting | Yes, including multi-symbol backtests | Yes, through the Strategy Tester with Pine Script strategies |
| Markets | Real-time US stocks and ETFs, plus futures, options, forex and crypto | Stocks on many exchanges, including NYSE, Nasdaq, London, Xetra, Euronext, ADX and DFM |
| Refunds | Within 72 hours of a full charge, trial fee excluded | Annual plans only, within 14 days of payment |
Prices are in US dollars and come from the official pricing pages on 4 Nov 2026. They can change. Sources: TrendSpider pricing, TradingView pricing, TradingView data coverage.
Free plan and trial
TradingView has a free Basic plan that never expires. It allows 1 chart per tab, 2 indicators per chart, 3 price alerts and 1 watchlist of 30 symbols. That is enough to learn the basics. The paid plans (Essential, Plus, Premium and Ultimate) raise those limits, and TradingView offers a free trial on Essential, Plus and Premium. It shows the trial length at sign-up.
TrendSpider has no free plan for the platform. Its standard trial lasts 14 days and costs from USD 19. On 4 Nov 2026 its pricing page was running a time-limited sale with a different, shorter trial offer, and it said promotional plans are final and non-refundable. Check the terms on the page before you pay.
Prices
TradingView costs USD 12.95 a month for Essential, billed yearly. Plus is USD 29.95, Premium USD 59.95 and Ultimate USD 199.95 a month on yearly billing. Monthly billing costs more. On 4 Nov 2026 the pricing page also showed sale prices, so what you see may be lower for a while. Real-time data for some exchanges costs extra.
TrendSpider Standard costs USD 89 a month billed monthly, or from USD 54 a month on a prepaid term. The higher plans are Premium (from USD 91 a month prepaid), Enhanced (from USD 122) and Advanced (from USD 214). TrendSpider says the code 10TS gives new customers 10% off any plan for 12 months.
For a beginner the gap is large. You can learn on TradingView for nothing, while TrendSpider’s cheapest plan costs more each month than TradingView’s entry plan.
Charts, scans and backtests
Automated analysis. This is TrendSpider’s main selling point. It can draw trendlines and Fibonacci levels for you and flag chart patterns, so you spend less time drawing by hand. TradingView’s paid plans list auto chart patterns and candlestick pattern recognition, but trendlines and most other drawings are up to you.
Scanning. TrendSpider can run scans based on a strategy, across several timeframes, and on a schedule. TradingView’s screeners filter stocks, ETFs, crypto and more by price, fundamentals and technical ratings on 150+ exchanges.
Backtesting. Both let you test a trading idea on past data. TrendSpider lists strategy development tools, multi-symbol backtests and AI-powered backtesting. In TradingView you test strategies written in Pine Script, or ones shared by the community. A good backtest result does not mean the idea will work in the future. If you want an AI assistant to point out key levels before earnings, see how to use WarrenAI.
Community. TradingView has a large public community where users post chart ideas and scripts. These are opinions from other users, not advice.
Markets covered
This matters if you invest outside the US.
- TradingView covers stock exchanges around the world, including the London Stock Exchange, Xetra, Euronext, ADX, DFM and Nasdaq Dubai. Data on some exchanges is delayed unless you pay for real-time data.
- TrendSpider lists real-time data for US stocks and ETFs, plus futures, options, forex and crypto. Its market data sources do not list UK, EU or UAE stocks.
If you trade London, Frankfurt or Dubai listed shares, TradingView is the clear fit of the two.
Who each one suits
TradingView may suit you if:
- you are new to charts and want to start for free;
- you follow markets outside the US;
- you want a big community and the option to write your own indicators.
TrendSpider may suit you if:
- you already trade often and use technical analysis;
- you mostly trade US stocks, ETFs, options or futures;
- you want automated trendlines, pattern recognition, backtests and alerts in one place, and are happy to pay for them.
For more detail, read our TrendSpider review and TradingView review, see prices on our TrendSpider and TradingView pages, or compare more options in our best charting tools ranking. If you want something other than TradingView, see our TradingView alternatives.
A word on charts and signals
Trendlines, patterns, indicator readings and backtest results describe what a price has done in the past. They are not signals that a price will rise or fall, and none of these tools knows your goals or how much risk you can take. Short-term trading is risky, and many people who trade often lose money.
Frequently asked questions
Is TrendSpider better than TradingView?
Neither is better for everyone. TrendSpider automates more of the chart work, with automated trendlines, pattern recognition and backtesting, and suits active US traders. TradingView has a free plan and covers far more markets, so it suits most beginners and anyone trading outside the US.
Is TrendSpider worth it compared to TradingView?
Only if you will use its automated tools often. TrendSpider has no free plan and Standard costs from USD 54 a month prepaid. If you mainly look at charts and set a few alerts, TradingView’s free plan or Essential plan may be enough.
Does TrendSpider have a free plan like TradingView?
No. TradingView’s Basic plan is free with no card. TrendSpider has no free plan for the platform, only a free tier of its AI assistant, and its 14-day trial costs from USD 19.
Can I use TrendSpider and TradingView together?
Yes. For example, you could keep TradingView’s free plan for charts on many markets and use TrendSpider for automated scans and backtests on US stocks. Paying for both only makes sense if you use both often.
Which is better for UK, European or UAE stocks?
TradingView. It lists exchanges such as London, Xetra, Euronext, ADX and DFM. TrendSpider’s market data sources list US stocks only.
Full prices and deals
| What | TrendSpider | TradingView |
|---|---|---|
| Score | Number 5 of 8 in charting tools | Number 2 of 8 in charting tools |
| Plan | Standard | Essential |
| Monthly price | $89.00 a month | $14.95 a month |
| Yearly price | To verify | $155.40 a year |
| First year with our link | Same as the yearly price | Same as the yearly price |
| After the first year | Enter 10TS at checkout. No end date announced. | First plan is at the normal price. |
| Free trial | No trial | Free trial |
| Free plan | No free plan for the platform (only a free tier of its AI assistant) | Yes. Basic plan, free forever, no card. 1 chart per tab, 2 indicators per chart, 1 watchlist of 30 symbols, 3 price alerts, 5K historical bars |
| Deal | Get the deal | Get the deal |
Other TrendSpider plans and prices
- Premium:USD 149 a month on monthly billing. Quarterly and yearly prepaid terms cost less, from USD 91 a month. New customers get a discount on the first invoice.
- Enhanced:USD 199 a month on monthly billing. Quarterly and yearly prepaid terms cost less, from USD 122 a month. New customers get a discount on the first invoice.
- Advanced:USD 349 a month on monthly billing. Quarterly and yearly prepaid terms cost less, from USD 214 a month. New customers get a discount on the first invoice.
Other TradingView plans and prices
- Essential:USD 12.95 a month when billed yearly
- Plus:USD 29.95 a month when billed yearly
- Premium:USD 59.95 a month when billed yearly
- Ultimate:USD 199.95 a month when billed yearly
Research, not advice. This article explains how tools work. It is general information, not a recommendation to buy or sell any investment, and not personal advice. Investing puts your capital at risk and you can get back less than you put in. Prices and plans change, so check the official site before you pay.
Some links on this page are affiliate links. If you subscribe through them we may earn a commission, at no extra cost to you. We score every tool on the same published criteria, using facts from official pages and our own testing. How we make money. This page is general information, not personal investment advice.
Read next
 ReviewTradingView reviewThe easiest place to learn and use stock charts, with a useful free plan. Not a source of ratings or picks.Read the review
 ReviewTrendSpider reviewPowerful automated charting, scanning and backtesting for chart-based traders. No free plan, and the trial costs money.Read the review
 ArticleBest TradingView alternatives in 2026, free and paidTradingView alternatives compared in plain English: free and paid charting and research tools, what each costs, and who each one suits best.Read the article

 ArticleBest stock alert apps in 2026, free and paidBest stock alert apps compared in plain English: price alerts, technical alerts and news alerts in TradingView, Seeking Alpha, Yahoo Finance and TrendSpider, with free limits and prices.Read the article