


Sorting a screener by the highest dividend yield is the most common way people look for dividend stocks. It is also risky. A yield goes up when the share price falls, so the top of the list can be full of companies in trouble, some of which later cut their dividend.
Investing.com’s new ProPicks AI strategy for US dividend stocks, called Rock Solid Dividends (code DIVUS15), tries to fix that. This guide explains how it works in plain words, using only Investing.com’s own pages, checked on 4 Nov 2026. The stocks on any such list are examples to research, not recommendations.
Rock Solid Dividends ranks US dividend payers on 45 factors, not just yield, and rebuilds the list every quarter. It is a useful shortlist to research, but it is a model, not advice.
Up to 55% off
Up to 55% off in the Early Bird sale until 24 Nov, 8pm Dubai time
Plus an extra 15% with code SRH. The 55% is on the 2-year plan. Yearly plans are 50% off. Monthly billing is not discounted. Check the final price at checkout.
What Rock Solid Dividends is
ProPicks AI is InvestingPro’s set of AI-picked stock strategies. Each one is run by a machine-learning model, was backtested before launch and is re-run on a fixed schedule. Rock Solid Dividends is the newest one and focuses on dividend stocks.
From the strategy page:
- Code: DIVUS15
- Market: United States, any sector, small, mid and large companies
- Holdings: up to 15 stocks
- Rebalance: quarterly
- Risk label: Low
- Benchmark: FTSE High Dividend Yield Index
- Backtest start: 1 Jan 2015
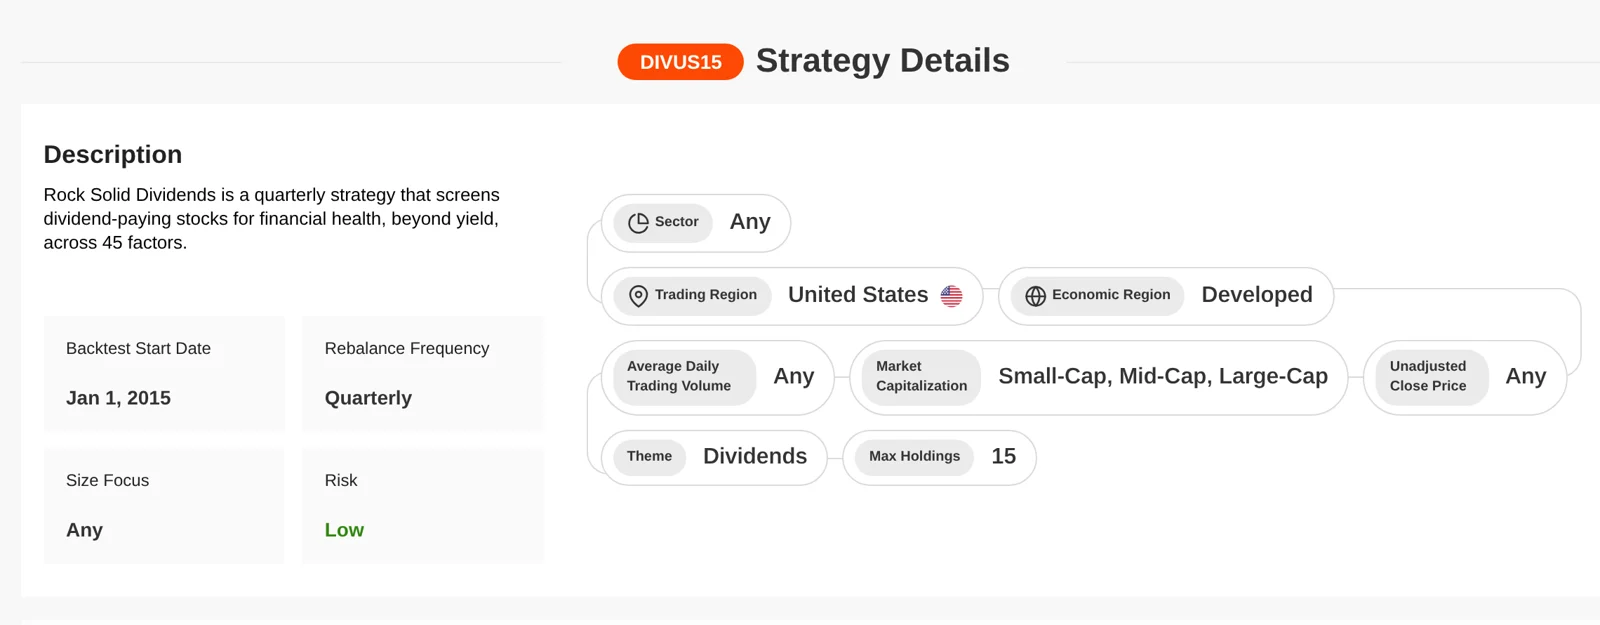
The strategy page describes it as “a quarterly strategy that screens dividend-paying stocks for financial health, beyond yield, across 45 factors”. Results before launch are a backtest, a simulation of the past, not real returns. Past and backtested returns do not guarantee future results.
How it scores each dividend stock
Investing.com’s launch article says the model makes three readings for every company and combines them into one score:
- Total return estimate: share price and dividends counted together.
- Risk reading: how much the company’s numbers look like those of companies that fell hard in the past, the pattern behind most dividend cuts.
- Dividend yield: weighted so a high yield helps, but never decides on its own.
There is no pass or fail gate. Every stock is ranked on the combined score, and the top of the ranking becomes the list.
The 45 metrics, grouped
Behind the three readings sit 45 metrics in ten areas. In plain words, the model asks whether the company earns enough to pay the dividend, whether it has too much debt, whether it has paid steadily and whether the business is growing.
| Area | What it checks |
|---|---|
| The dividend itself | Yield, free cash flow yield, and payout ratios on cash flow and on earnings |
| Price | Price to earnings, to book, to free cash flow, and enterprise value to sales |
| Quality | Return on assets, gross margin and how steady the valuation has been |
| Debt | Interest cover, debt to equity, debt to EBITDA and debt to capital |
| Share price swings | How much the price moves month to month |
| Price direction | 6-month and 1-year return, and distance from the 52-week high |
| Size | Market value |
| Growth | Growth and 12-month trends in revenue, profit and margin |
| Track record | Dividend streak, dividend growth, and how steady cash flow and profits have been |
| Combinations | Pairs judged together, for example a high yield only scores well if the dividend is also covered by cash |
Grouping from Investing.com’s launch article. Yield is one of the 45 and carries extra weight, because it is a dividend strategy.
One thing to know: the same strategy page also has a general line saying the ProPicks AI rating model is “trained on over 50 financial signals”. The 45 factors are the dividend checks for this strategy.
Why it rebalances every quarter
The list is rebuilt every quarter from the latest financial data. If a company’s numbers get weaker, it slides down the ranking and can drop off at the next rebuild. Investing.com also says it changed how all ProPicks AI strategies drop a stock: a stock is now only removed when its score falls by a meaningful amount, which it says halves the monthly turnover in its backtests.
For you, that means fewer changes to follow. It also means a stock can stay on the list for a while after news you may care about, so keep reading the company updates yourself.
It shows why each stock is on the list
Every stock in a ProPicks AI strategy comes with the reasons it was picked. That is the useful part for research. Instead of a bare ticker, you see what the model liked, such as strong cash cover or low debt, and you can check those points on the company’s own pages. The full stock list is locked behind a paid plan.
Which plan you need
This is the one point we could not settle. The InvestingPro plans page lists “Dividend ProPicks AI strategies” under Pro Max, while the Rock Solid Dividends page is labelled Pro+. If this strategy is the main reason you subscribe, check which plan unlocks it before you pay. At the time of writing the pricing page shows up to 55% off in the Early Bird sale until 24 Nov, 8pm Dubai time. Our InvestingPro review and InvestingPro pricing page cover the plans.
How to use it without treating it as advice
- Use it as a shortlist. Open each company and check the dividend history, the payout ratio and the latest results.
- Ask questions. WarrenAI, InvestingPro’s AI chat, can explain one stock or a whole list. See our WarrenAI guide.
- Track the income. If you hold dividend stocks, a tracker such as Snowball Analytics shows your dividend income and calendar. Our portfolio tracker ranking compares more.
- Compare picks. Other services also publish stock lists. See our best stock pick services ranking.
Frequently asked questions
What is ProPicks AI Rock Solid Dividends?
It is an AI-picked strategy from InvestingPro for US dividend stocks, code DIVUS15. It ranks dividend payers on 45 factors, holds up to 15 stocks and is rebalanced every quarter.
How many metrics does it check?
- Investing.com’s launch article lists all of them in ten areas, from dividend cover and debt to growth and track record. Yield is one of the 45.
Does it only pick high-yield stocks?
No. Yield helps a stock’s score, but it never decides on its own. A high yield only scores well when the dividend is also covered by cash flow and earnings and the share price is not collapsing.
Are the returns shown real?
Results from before launch are a backtest, a simulation of how the picks would have done in the past. Investing.com says backtested and past performance do not guarantee future outcomes.
Are the stocks on the list recommendations?
No. They are model output and examples to research. Investing.com says ProPicks AI is for general information and is not investment advice. Nothing in this guide is advice either.
Prices at a glance
Prices from each official pricing page. Prices can differ by region and may exclude tax.
Research, not advice. This article explains how tools work. It is general information, not a recommendation to buy or sell any investment, and not personal advice. Investing puts your capital at risk and you can get back less than you put in. Prices and plans change, so check the official site before you pay.
Some links on this page are affiliate links. If you subscribe through them we may earn a commission, at no extra cost to you. We score every tool on the same published criteria, using facts from official pages and our own testing. How we make money. This page is general information, not personal investment advice.
Read next
 ReviewInvestingPro reviewStrong valuation tools across many markets. No free plan, and the first-year sale price renews higher.Read the review
 ReviewSnowball Analytics reviewDividend tracking and broker sync at a low price, with a 14-day free trial.Read the review ArticleWarrenAI: how to use it on your watchlist before earningsHow to use WarrenAI from Investing.com to read a whole watchlist, its charts and key levels ahead of earnings, with prompts, limits and plan credits.Read the article ArticleWhy stocks fall after beating earnings: check Fair Value and WarrenAI firstA stock can beat earnings and still fall. See why, with Palantir, AMD and Arista from November 2026, and how Fair Value, Financial Health and WarrenAI help you check.Read the article