
If you own more than one ETF, some of the same companies may sit inside several of them. That is ETF overlap. A little is normal. A lot means you are less spread out than you think, because one company or one sector can end up with a bigger share of your money than you planned.
An ETF overlap tool shows you how much two funds have in common. This page compares the free tools we tried, shows what each one found for the same example pair, and explains why they do not always agree. Every fact comes from the official tool pages, read on 3 and 4 Nov 2026. It is general information, not advice on which funds to buy.
For a quick free check of two ETFs, use the Snowball ETF Overlap Tool or ETFRC Fund Overlap, and to see overlap across a whole portfolio you need a tracker such as one of these. The funds below are only examples, not recommendations.
What ETF overlap means
Most ETFs hold a basket of stocks. Two different funds can hold many of the same stocks. For example, a fund that tracks the S&P 500 and a fund that tracks the Nasdaq-100 both hold large US technology companies.
There are two ways to measure overlap:
- By count: how many stocks the two funds share. This is easy to read but can mislead, because a fund may hold hundreds of small positions that barely matter.
- By weight: how much of each fund’s money sits in the shared stocks. This is usually the more useful number. A common method takes, for each shared stock, the smaller of its two weights and adds them all up.
A high overlap by weight means the two funds will often move in a similar way. That is not good or bad on its own. It just means owning both may add less variety than you expect.
The free tools, compared on the same pair
We checked the same pair in each tool: VOO (Vanguard S&P 500 ETF) and QQQ (Invesco QQQ Trust). Both are only examples.
| What the tool showed | Snowball ETF Overlap Tool | ETFRC Fund Overlap |
|---|---|---|
| Holdings in VOO | 503 | 509 |
| Holdings in QQQ | 101 | 104 |
| Shared holdings | 84 (83.2% of QQQ's holdings) | 83 |
| Overlap by weight | 46.4% | 52% |
Both pages were checked signed out on 4 Nov 2026. The figures change as the funds update their holdings. The funds are only examples, not recommendations.
Snowball ETF Overlap Tool
- Cost: free, no account needed.
- What it shows: overlap by weight, the number of shared stocks, stocks found in only one fund, sector breakdowns side by side, the expense ratio of each fund, and a table of holdings with each fund’s weight.
- How it measures: it adds up the smaller weight of each shared stock.
- Good to know: the page gives its own rule of thumb. Under 30% overlap suggests the two funds complement each other; above 60% suggests a lot of duplication. Popular pairs have ready-made pages, such as VOO vs QQQ.
- Limits: it compares two funds at a time. To check a whole portfolio, you need the Snowball app, which shows overlap across the funds you hold.
ETFRC Fund Overlap
- Cost: free, no account needed for the main result.
- What it shows: overlap by weight, the number of shared holdings, how many holdings each fund has and what share of each also sits in the other fund, plus a sector drift chart.
- Good to know: for VOO vs QQQ it showed 83 shared holdings, so most of QQQ’s 104 holdings are also in VOO, while only a small part of VOO’s 509 holdings are in QQQ. That is a useful way to see that a small fund can sit almost entirely inside a big one.
- Limits: signed out, only the top 5 shared holdings are listed. The full list needs a free Basic membership. ETFRC’s Portfolio Builder handles more than two funds.
Why the two tools give different numbers
On 4 Nov 2026 Snowball showed 46.4% overlap by weight for VOO vs QQQ, and ETFRC showed 52%. They also counted different numbers of holdings (503 against 509 for VOO, 101 against 104 for QQQ). Both are reasonable. Tools use holdings files from different dates, can treat share classes differently (for example two Alphabet share classes) and may use slightly different maths. Treat any overlap figure as a rough guide, not an exact number, and compare funds in the same tool.
Checking overlap across your whole portfolio
Comparing two funds is a good start. If you hold several ETFs plus some single stocks, a portfolio tool can show what you really own in total.
Sharesight Exposure Report
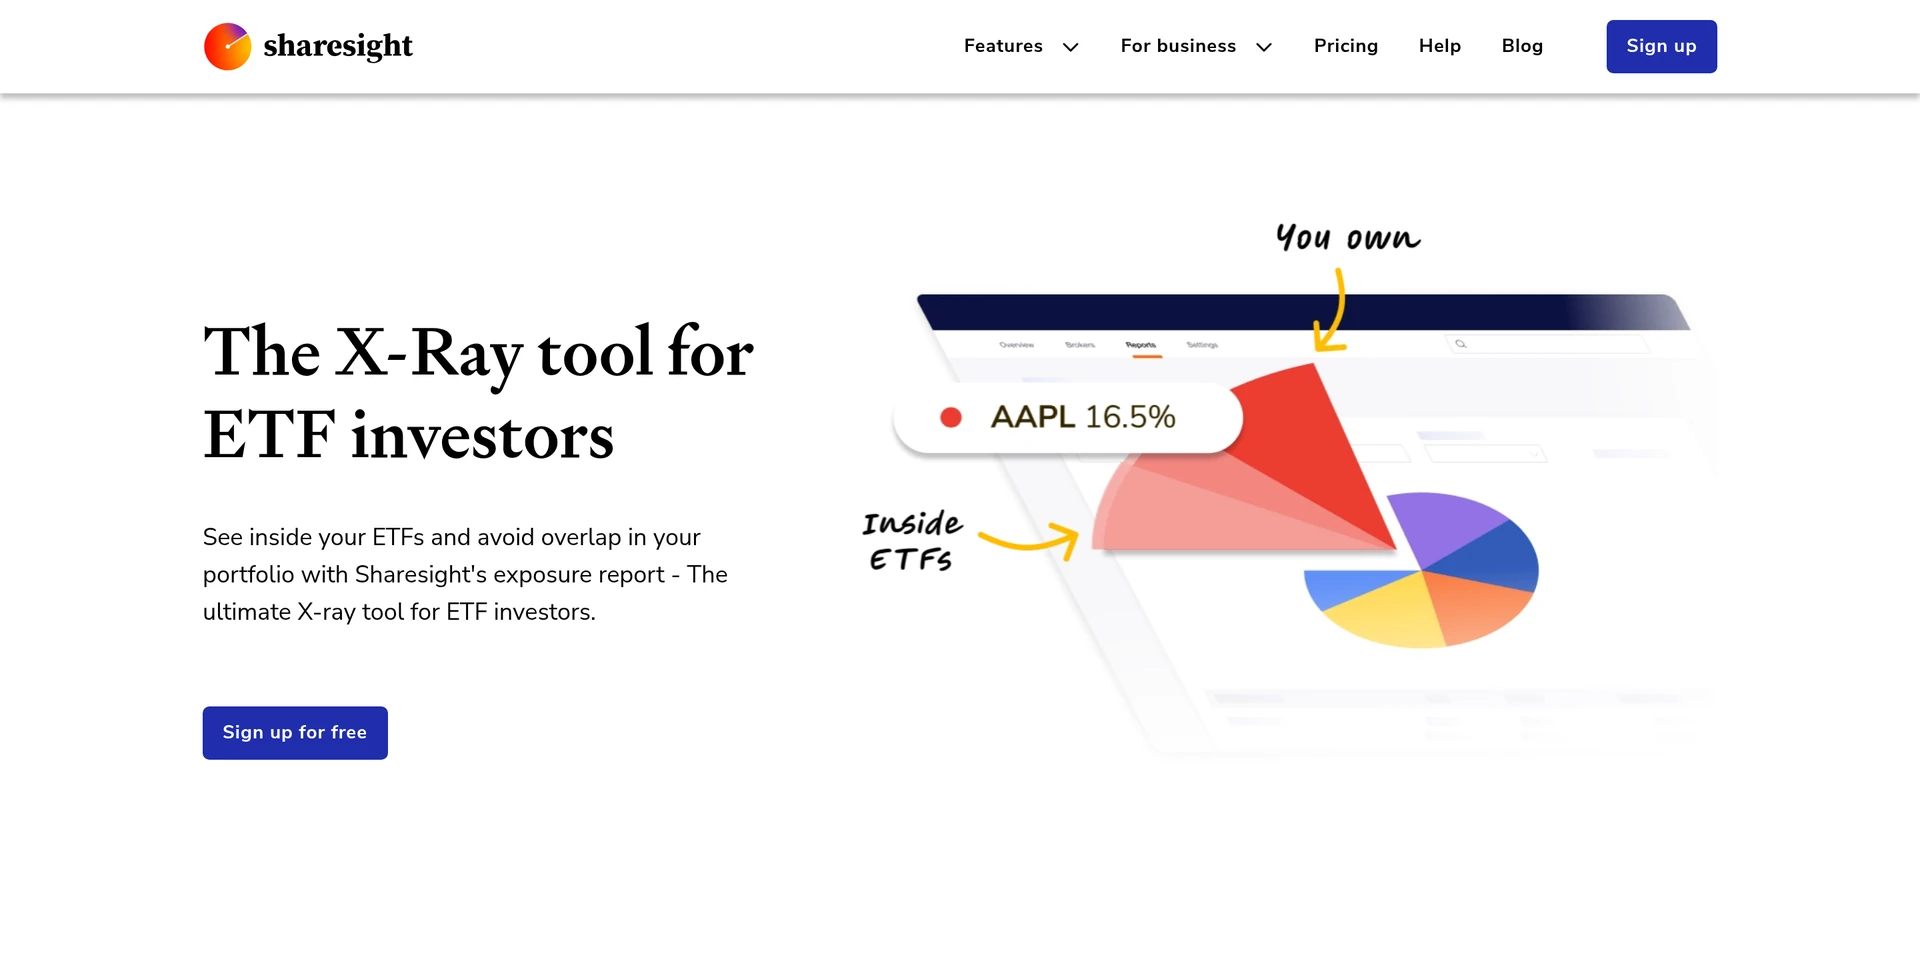
- What it does: shows the stocks you hold directly next to the stocks you hold through ETFs, so you can see your total exposure to each company.
- Coverage: ETFs listed in Australia, Canada, New Zealand, the UK, the US and Europe, based on Sharesight’s help page.
- Detail: up to the top 500 underlying holdings (50 on the Starter plan), which you can group and export to PDF or Excel.
- Cost: paid plans only. Sharesight’s paid plans start at USD 7 a month billed yearly. See our Sharesight review.
Snowball portfolio tracker
The free Snowball overlap page compares two funds. Inside the Snowball app, once you add or connect your holdings, you can see overlap across the funds you own. Paid plans start at USD 6.67 a month billed yearly, with a 14-day free trial. See our Snowball review.
Morningstar Stock Intersection and X-Ray
Morningstar Investor has two portfolio tools that help with overlap:
- Stock Intersection shows the top 50 stocks you hold across all your funds and ETFs combined.
- X-Ray breaks a portfolio down by asset class, sector, region, fees and investment style.
Both are part of the paid Morningstar Investor plan, which has a 7-day free trial. See our Morningstar review.
Stock Rover
Stock Rover is mainly a research and screening tool for US and Canadian stocks. It is not built as an ETF overlap tool, but every plan includes portfolio tools with broker links, so you can see what you hold in one place. See our Stock Rover review.
Doing it by hand
You can also check overlap without any tool. Every ETF issuer publishes the fund’s holdings on the fund page, usually as a downloadable file. Download the holdings for each fund, put them side by side in a spreadsheet, and compare the largest positions. This takes longer, but it lets you see exactly where the data comes from.
How to use the result
- Look at the top holdings first. Overlap usually comes from a handful of very large companies.
- Check sectors as well as stocks. Two funds can share few stocks but still lean heavily on the same sector.
- Remember fees. If two funds overlap a lot, compare what each one costs to hold.
- Do not chase a perfect number. Some overlap is normal, especially with broad market funds.
If you are not sure which kind of tool you need, our tool finder asks a few questions and suggests a starting point. For tools that track your whole portfolio, see our best portfolio trackers. For allocation, risk and returns as well as overlap, see our portfolio analyzer tools guide.
Frequently asked questions
What is an ETF overlap tool?
It is a tool that compares the holdings of two or more ETFs and shows how much they have in common, usually as a percentage of each fund’s weight and as a count of shared stocks.
Is there a free ETF overlap tool?
Yes. The Snowball ETF Overlap Tool and ETFRC Fund Overlap are both free and work without an account. ETFRC shows only the top 5 shared holdings unless you sign up for its free Basic membership.
What is a good ETF overlap percentage?
There is no single right number. Snowball’s own guide says under 30% suggests the funds complement each other and above 60% suggests a lot of duplication. Use it as a rough guide, not a rule.
Why do overlap tools show different numbers for the same ETFs?
They may use holdings data from different dates, treat share classes differently and use slightly different maths. For VOO vs QQQ on 3 Nov 2026, Snowball showed 46.4% and ETFRC 52%.
Can I check overlap for my whole portfolio?
Yes, with a portfolio tracker. Sharesight’s Exposure Report, the Snowball app and Morningstar’s Stock Intersection and X-Ray look across all your holdings. All three need a paid plan for those features.
Prices at a glance
Prices from each official pricing page. Prices can differ by region and may exclude tax.
Research, not advice. This article explains how tools work. It is general information, not a recommendation to buy or sell any investment, and not personal advice. Investing puts your capital at risk and you can get back less than you put in. Prices and plans change, so check the official site before you pay.
Some links on this page are affiliate links. If you subscribe through them we may earn a commission, at no extra cost to you. We score every tool on the same published criteria, using facts from official pages and our own testing. How we make money. This page is general information, not personal investment advice.
Read next
 ReviewSnowball Analytics reviewDividend tracking and broker sync at a low price, with a 14-day free trial.Read the review
 ReviewSharesight reviewStrong dividend and tax reporting across brokers. Not a tool for finding new stocks.Read the review
 ArticlePortfolio analyzer tools compared (2026), free and paidPortfolio analyzer tools compared in plain English: allocation, overlap, risk and returns in Snowball, Morningstar X-Ray, Sharesight, getquin and Portfolio Visualizer, with prices.Read the article
 ArticleBest net worth trackers in 2026, free and paidThe best net worth trackers and apps for investors compared: free plans, prices, what each one can track, and who each one suits best.Read the article